
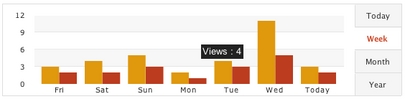
Today we added the ability for you to track number of times that your form has been viewed in addition to the number of times that the form has been completed. To view these graphs, just head to the form manager section and click on the button labeled statistics. The tab marked ‘Today’ only shows the entries for the day, but the week, month, and year tabs display both the hits and views that your forms have received. We’re excited to get this out because part our long term strategy to help our users not only create forms, but to optimize their forms in order to receive a higher completion rate.
You may also notice that the appearance of the graphs are a little different than before. We weren’t entirely satisfied with the speed and flexibility that our old graphing tool provided, so we’re now moving over to [FusionCharts](http://fusioncharts.com/). If you take a look at some of their [examples](http://fusioncharts.com/Gallery.asp?gMenuItemId=3), you’ll see that you can make some pretty sweet looking graphs with them. We’ll eventually be moving our reporting graphs over to FusionCharts in order to make those a little faster and better looking.
Comments
Is there any way you can make the reports generate in a way that will do sums as well as percentages?? I have a need for reports that will give me totals. Is that a possibility?
Posted April 5th, 2007 by Heath.Sorry, Heath, but reports can’t do that just yet.
Posted April 5th, 2007 by Chris Campbell.Is there a way to view these statistics as a report? And also be able to download this data (number of entries by day of week or hour of day)? Thanks!
Posted April 5th, 2007 by Angela Kille.Sorry, Angela, but these stats haven’t made it into reports. We will be adding some more filtering by date options in the upcoming months, though.
Posted April 5th, 2007 by Chris Campbell.