By Kevin Hale
Alright, we got some good stuff to announce today. Thanks to our man Alex, who added some sweet caching action to Wufoo reports over the last few weeks, everyone should have seen a nice boost in speed on the loading of their reports, charts and graphs. One of the nice side effects of implementing caching for our reporting system is that we were able to use that as the foundation for creating code snippets to integrate your reports and widgets into your own web sites!
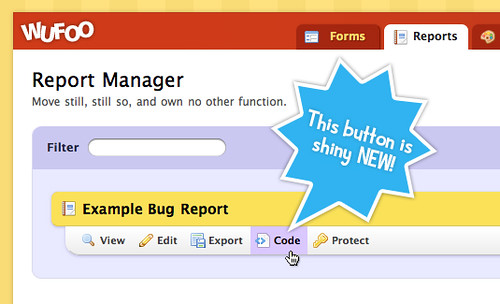
To access the new Code Manager for reports, just make your report public by checking off the Public checkbox sitting to the right of your report’s name in the Report Manager. When you do this, the Code button will appear below the report’s name. The interface should be very familiar to those of you used to the Code Manager we provide for Form code snippets:
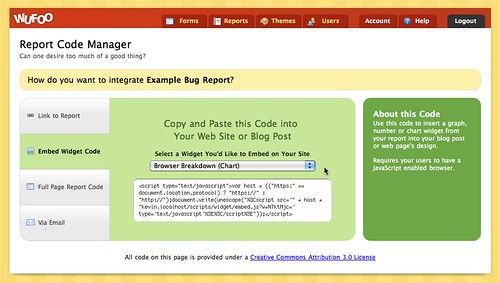
The Report Code Manager provides access to the following features:
-
Convenient copy/paste URLs and HTML links to your Reports hosted on Wufoo. You’ll see that we now provide encrypted permanent URL structures for users wanting links that wont change when you edit your Report’s name.
-
Downloadable HTML file to instantly get a full page version of your report on your site. Just like our Full Page Form Code file, all you have to do is upload the file to your server and you’ve got a Wufoo report showing from your own domain.
-
One click pre written email for sharing your report with friends and fellow data lovers.
-
And our favorite, sweet JavaScript snippets that you can use to embed individual graph, chart and number widgets from your report right into your blog posts and web pages.
JavaScript Embed for Report Widgets
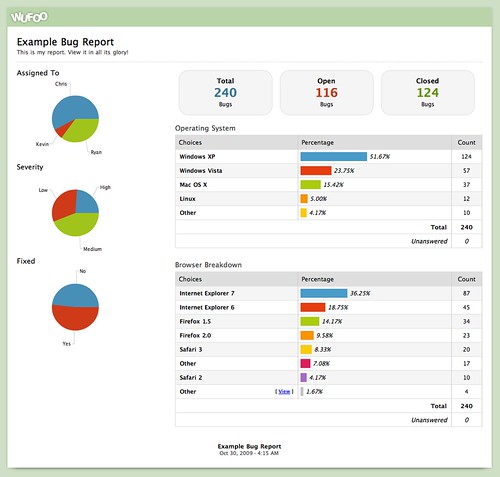
These new embeddable report widgets open up a lot of possibilities for our power users wanting more flexibility in how they share their data with their users. For example, if you’ve got a totally sweet report like this created in Wufoo:
And you want to just share one of the graphs or tables of data in a blog post or web page, you can go to the Code Manager for that Report, grab the JavaScript snippet for that specific widget and paste it into a web page like this!
Yup, that’s a live widget up there based on filler content collected from one of our example forms. Or if you want to create a mini dashboard highlighting a specific metric, you can insert just the number widget from the report like this!
The possibilities are really endless. These embeddable widgets are based on live data collected from your Wufoo form, which means they’ll automatically update as new entries are collected. Because they’re based on the widgets in your report, any filters you apply or changes you make to that widget in Wufoo’s Report Builder will also automatically be reflected on the embedded version. These new features are available to all users across all plans and we hope you enjoy showcasing your data in new and exciting ways!